E-commerce Performance: Meta Ads Analytics Dashboard
Designed and built a comprehensive, interactive analytics dashboard in Tableau to track, visualize, and optimize Meta (Facebook/Instagram) advertising performance for the Saraai e-commerce brand. The tool delivered actionable insights to maximize Return on Ad Spend (ROAS) and reduce Cost Per Acquisition (CPA)
Data Visualization, Analytics and BI

Project Overview
Client: Saraai E-commerce (Internal Project)
Tool Stack: Meta Ads Manager Data Source, Tableau Desktop/Public.
Timeline: 8 weeks (2024)
My Role: Data Visualization Specialist & Performance Analyst.
I created an easy to use, comprehensive dashboard to track the KPIs like PPC, Conversion rate, CAC, Cart Abandonment ratio, Returns Indicator, etc., to easily analyse and track the metrics, resulting in quick decision making in the ecommerce business.
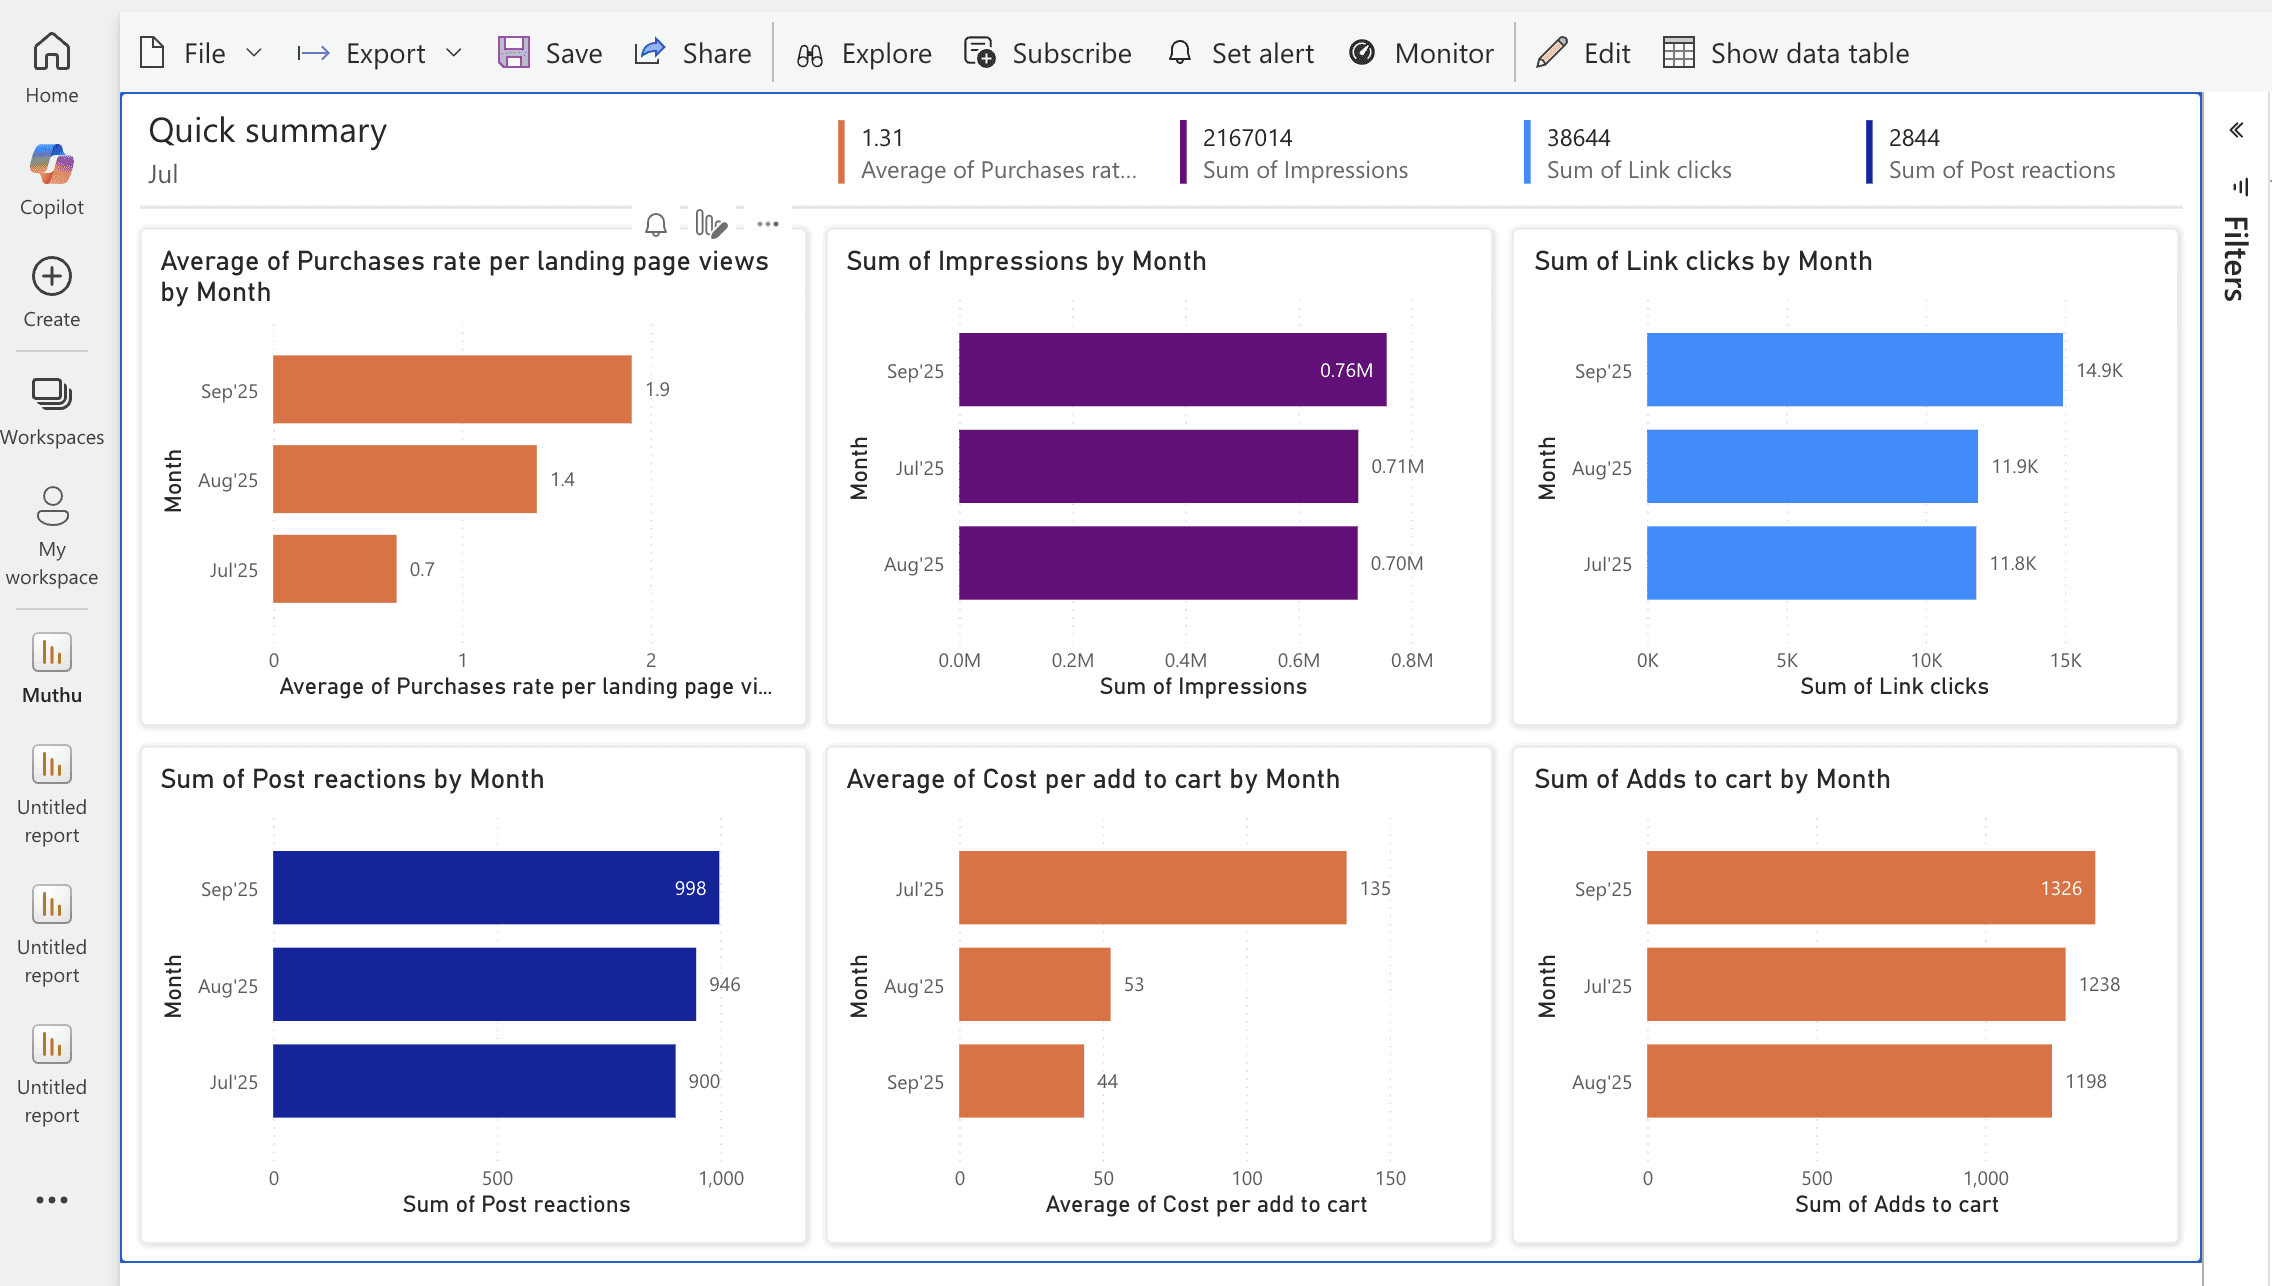
The dashboard was structured to track three main KPIs to provide a result oriented, top-down analysis:
ROAS (Return on Ad Spend): The primary KPI, visualizing total revenue generated per dollar spent.
CPA (Cost Per Acquisition): Tracking efficiency—the cost to acquire one customer.
Creative Analysis: A table and charts allowing filtering by Ad Creative and Ad Copy to identify the highest-converting assets.
Each of these metrics give an actionable insight with each targeting a different area of growth in a Ecommerce operation.
Dashboard